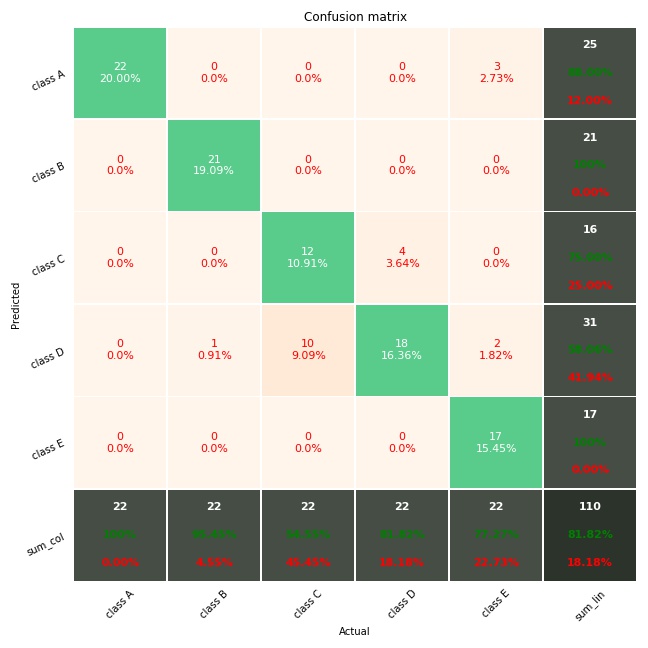
画的混淆矩阵非常漂亮,自从用了这个来分析图像分类,整个人都精神了。
看一下图

from pandas import DataFrame
import numpy as np
import matplotlib.pyplot as plt
import matplotlib.font_manager as fm
from matplotlib.collections import QuadMesh
import seaborn as sn
def get_new_fig(fn, figsize=[9,9]):
    """ Init graphics """
    fig1 = plt.figure(fn, figsize)
    ax1 = fig1.gca()   #Get Current Axis
    ax1.cla() # clear existing plot
    return fig1, ax1
def configcell_text_and_colors(array_df, lin, col, oText, facecolors, posi, fz, fmt, show_null_values=0):
    text_add = []; text_del = [];
    cell_val = array_df[lin][col]
    tot_all = array_df[-1][-1]
    per = (float(cell_val) / tot_all) * 100
    curr_column = array_df[:,col]
    ccl = len(curr_column)
    #last line  and/or last column
    if(col == (ccl - 1)) or (lin == (ccl - 1)):
        #tots and percents
        if(cell_val != 0):
            if(col == ccl - 1) and (lin == ccl - 1):
                tot_rig = 0
                for i in range(array_df.shape[0] - 1):
                    tot_rig += array_df[i][i]
                per_ok = (float(tot_rig) / cell_val) * 100
            elif(col == ccl - 1):
                tot_rig = array_df[lin][lin]
                per_ok = (float(tot_rig) / cell_val) * 100
            elif(lin == ccl - 1):
                tot_rig = array_df[col][col]
                per_ok = (float(tot_rig) / cell_val) * 100
            per_err = 100 - per_ok
        else:
            per_ok = per_err = 0

        per_ok_s = ['%.2f%%'%(per_ok), '100%'] [per_ok == 100]


        text_del.append(oText)

        font_prop = fm.FontProperties(weight='bold', size=fz)
        text_kwargs = dict(color='w', ha="center", va="center", gid='sum', fontproperties=font_prop)
        lis_txt = ['%d'%(cell_val), per_ok_s, '%.2f%%'%(per_err)]
        lis_kwa = [text_kwargs]
        dic = text_kwargs.copy(); dic['color'] = 'g'; lis_kwa.append(dic);
        dic = text_kwargs.copy(); dic['color'] = 'r'; lis_kwa.append(dic);
        lis_pos = [(oText._x, oText._y-0.3), (oText._x, oText._y), (oText._x, oText._y+0.3)]
        for i in range(len(lis_txt)):
            newText = dict(x=lis_pos[i][0], y=lis_pos[i][1], text=lis_txt[i], kw=lis_kwa[i])
            #print 'lin: %s, col: %s, newText: %s' %(lin, col, newText)
            text_add.append(newText)
        #print '\n'
        carr = [0.27, 0.30, 0.27, 1.0]
        if(col == ccl - 1) and (lin == ccl - 1):
            carr = [0.17, 0.20, 0.17, 1.0]
        facecolors[posi] = carr

    else:
        if(per > 0):
            txt = '%s\n%.2f%%' %(cell_val, per)
        else:
            if(show_null_values == 0):
                txt = ''
            elif(show_null_values == 1):
                txt = '0'
            else:
                txt = '0\n0.0%'
        oText.set_text(txt)

        #main diagonal
        if(col == lin):
            #set color of the textin the diagonal to white
            oText.set_color('w')
            # set background color in the diagonal to blue
            facecolors[posi] = [0.35, 0.8, 0.55, 1.0]
        else:
            oText.set_color('r')

    return text_add, text_del
def insert_totals(df_cm):
    """ insert total column and line (the last ones) """
    sum_col = []
    for c in df_cm.columns:
        sum_col.append( df_cm[c].sum() )
    sum_lin = []
    for item_line in df_cm.iterrows():
        sum_lin.append( item_line[1].sum() )
    df_cm['sum_lin'] = sum_lin
    sum_col.append(np.sum(sum_lin))
    df_cm.loc['sum_col'] = sum_col

def pretty_plot_confusion_matrix(df_cm, annot=True, cmap="Oranges", fmt='.2f', fz=11,
      lw=0.5, cbar=False, figsize=[8,8], show_null_values=0, pred_val_axis='y'):
    """
      print conf matrix with default layout (like matlab)
      params:
        df_cm          dataframe (pandas) without totals
        annot          print text in each cell
        cmap           Oranges,Oranges_r,YlGnBu,Blues,RdBu, ... see:
        fz             fontsize
        lw             linewidth
        pred_val_axis  where to show the prediction values (x or y axis)
                        'col' or 'x': show predicted values in columns (x axis) instead lines
                        'lin' or 'y': show predicted values in lines   (y axis)
    """
    if(pred_val_axis in ('col', 'x')):
        xlbl = 'Predicted'
        ylbl = 'Actual'
    else:
        xlbl = 'Actual'
        ylbl = 'Predicted'
        df_cm = df_cm.T

    # create "Total" column
    insert_totals(df_cm)

    #this is for print allways in the same window
    fig, ax1 = get_new_fig('Conf matrix default', figsize)

    #thanks for seaborn
    ax = sn.heatmap(df_cm, annot=annot, annot_kws={"size": fz}, linewidths=lw, ax=ax1,
                    cbar=cbar, cmap=cmap, linecolor='w', fmt=fmt)

    #set ticklabels rotation
    ax.set_xticklabels(ax.get_xticklabels(), rotation = 45, fontsize = 10)
    ax.set_yticklabels(ax.get_yticklabels(), rotation = 25, fontsize = 10)

    # Turn off all the ticks
    for t in ax.xaxis.get_major_ticks():
        t.tick1On = False
        t.tick2On = False
    for t in ax.yaxis.get_major_ticks():
        t.tick1On = False
        t.tick2On = False

    #face colors list
    quadmesh = ax.findobj(QuadMesh)[0]
    facecolors = quadmesh.get_facecolors()

    #iter in text elements
    array_df = np.array( df_cm.to_records(index=False).tolist() )
    text_add = []; text_del = [];
    posi = -1 #from left to right, bottom to top.
    for t in ax.collections[0].axes.texts: #ax.texts:
        pos = np.array( t.get_position()) - [0.5,0.5]
        lin = int(pos[1]); col = int(pos[0]);
        posi += 1
        #print ('>>> pos: %s, posi: %s, val: %s, txt: %s' %(pos, posi, array_df[lin][col], t.get_text()))

        #set text
        txt_res = configcell_text_and_colors(array_df, lin, col, t, facecolors, posi, fz, fmt, show_null_values)

        text_add.extend(txt_res[0])
        text_del.extend(txt_res[1])

    #remove the old ones
    for item in text_del:
        item.remove()
    #append the new ones
    for item in text_add:
        ax.text(item['x'], item['y'], item['text'], **item['kw'])

    #titles and legends
    ax.set_title('Confusion matrix')
    ax.set_xlabel(xlbl)
    ax.set_ylabel(ylbl)
    plt.tight_layout()  #set layout slim
    fig.savefig('./混淆矩阵.jpg')
    plt.show()

def plot_confusion_matrix_from_data(y_test, predictions, columns=None, annot=True, cmap="Oranges",
      fmt='.2f', fz=11, lw=0.5, cbar=False, figsize=[8,8], show_null_values=0, pred_val_axis='lin'):
    from sklearn.metrics import confusion_matrix
    from pandas import DataFrame

    #data
    if(not columns):
        #labels axis integer:
        ##columns = range(1, len(np.unique(y_test))+1)
        #labels axis string:
        from string import ascii_uppercase
        columns = ['class %s' %(i) for i in list(ascii_uppercase)[0:len(np.unique(y_test))]]

    confm = confusion_matrix(y_test, predictions)
    cmap = 'Oranges';
    fz = 11;
    figsize=[9,9];
    show_null_values = 2
    df_cm = DataFrame(confm, index=columns, columns=columns)
    pretty_plot_confusion_matrix(df_cm, fz=fz, cmap=cmap, figsize=figsize, show_null_values=show_null_values, pred_val_axis=pred_val_axis)
def confusion_matrix_data_class(y_test,predic):
    columns = []
    annot = True;
    cmap = 'Oranges';
    fmt = '.2f'
    lw = 0.5
    cbar = False
    show_null_values = 2
    pred_val_axis = 'y'
    #size::
    fz = 12;
    figsize = [9,9];
    if(len(y_test) > 10):
        fz=9; figsize=[14,14];
    plot_confusion_matrix_from_data(y_test, predic, columns,
      annot, cmap, fmt, fz, lw, cbar, figsize, show_null_values, pred_val_axis)
#
if(__name__ == '__main__'):
    y_test = np.array([1,2,3,4,5, 1,2,3,4,5, 1,2,3,4,5, 1,2,3,4,5, 1,2,3,4,5, 1,2,3,4,5, 1,2,3,4,5, 1,2,3,4,5, 1,2,3,4,5, 1,2,3,4,5, 1,2,3,4,5, 1,2,3,4,5, 1,2,3,4,5, 1,2,3,4,5, 1,2,3,4,5, 1,2,3,4,5, 1,2,3,4,5, 1,2,3,4,5, 1,2,3,4,5, 1,2,3,4,5, 1,2,3,4,5, 1,2,3,4,5])
    predic = np.array([1,2,4,3,5, 1,2,4,3,5, 1,2,3,4,4, 1,4,3,4,5, 1,2,4,4,5, 1,2,4,4,5, 1,2,4,4,5, 1,2,4,4,5, 1,2,3,3,5, 1,2,3,3,5, 1,2,3,4,4, 1,2,3,4,1, 1,2,3,4,1, 1,2,3,4,1, 1,2,4,4,5, 1,2,4,4,5, 1,2,4,4,5, 1,2,4,4,5, 1,2,3,4,5, 1,2,3,4,5, 1,2,3,4,5, 1,2,3,4,5])
    confusion_matrix_data_class(y,predic)
    plt.show()